Showcased Data Stories and Applications using Open Data Pakistan.
I have designed a user-friendly dashboard addressing the recent health care challenges raised by COVID-19. Punjab is currently the most affected province in Pakistan, with an alarming rise in critically ill patients resulting in overburdened hospitals. Therefore, it is essential to effectively utilize and manage hospital bed capacity to avoid overload.
Keeping this in mind, I gathered the most recent data from the Punjab Health Department report on hospital bed statistics and created this interactive dashboard as a guide for local citizens in need. A user can simply identify the availability of the required hospital bed for each hospital within a few seconds based on their city and...
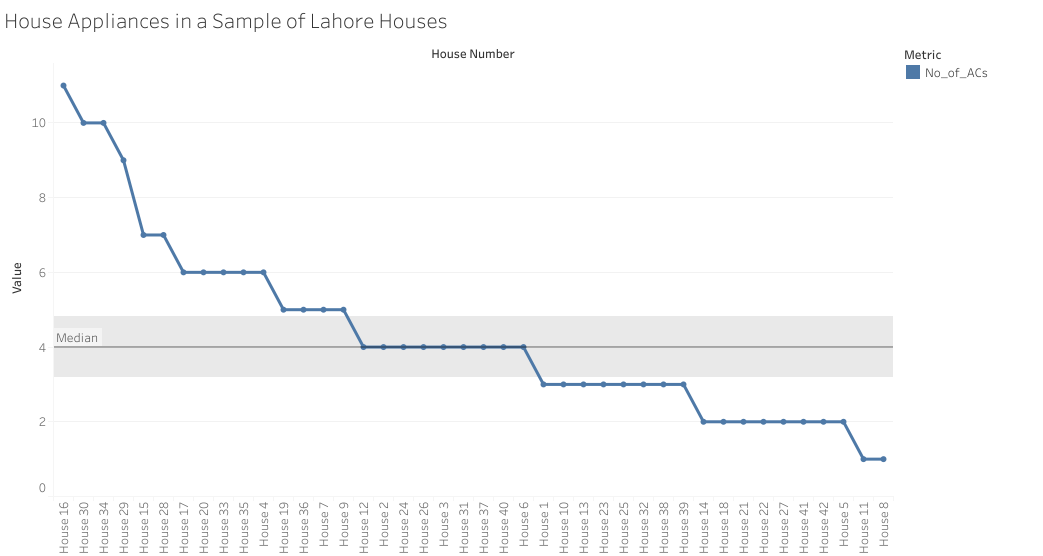
This vizualization shows a distribution of house applications in a representative sample of 42 houses from the PRECON metadata. The median number of ACs across Lahore in the sample is 4. Similary medians and house-wise distribution can be seen for other applicance across houses in Lahore.
PRECON is a first of its kind extensive dataset of electricity consumption patterns of users in developing countries. The dataset has been collected through smart meters over a period of one year and comprise of data of users belonging to different demographics and different social and financial backgrounds. It provides details of electricity consumption data and meta-data of houses opted for data...
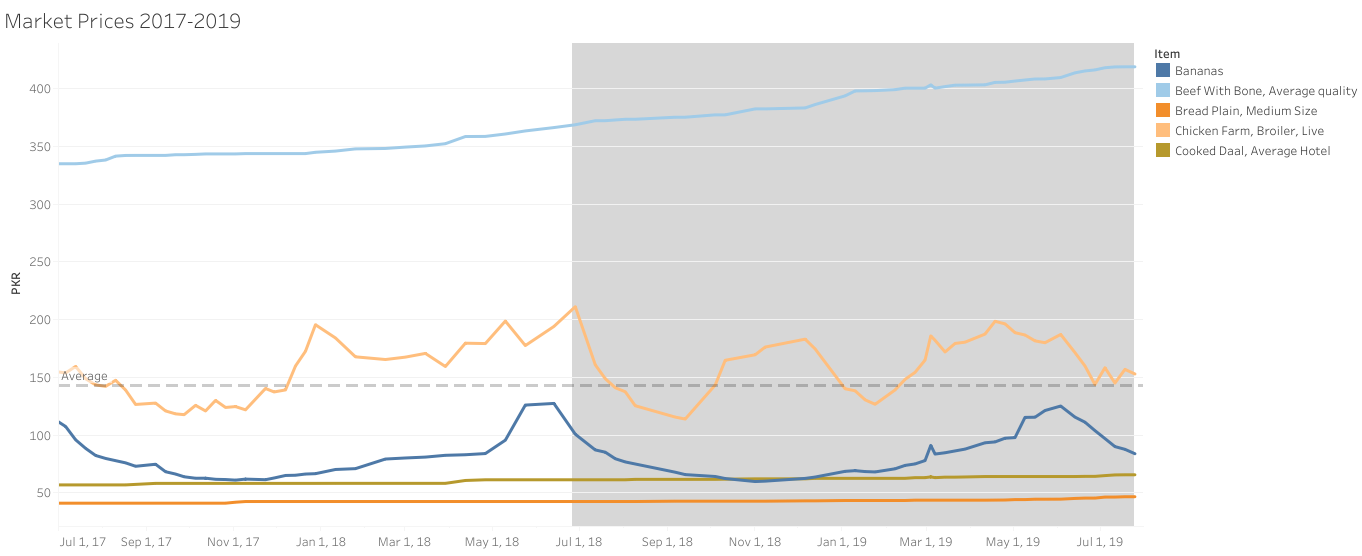
Prices (June 2017 – July 2019) extracted from the Sensitive Price Index (SPI) computed to assess the price movement of 53 essential commodities in 73 markets of 17 cities of Pakistan on weekly basis to review the price situation.
Climate change is likely to hurt developing nations the hardest. It impacts temperatures, rainfalls, sea levels and, more often, climate-related disasters. At an alarming stake is the recent spike in the struggle against poverty, hunger, disease, and loss of lives. Tackling climate change requires exceptional global cross-border cooperation.
The presented dashboard addresses the need for immediate climate action to protect the planet and ensure a safe and healthy environment for future generations. Data has been collected and visualized for diverse climate indicators of Pakistan, including forest area, gas emissions, and average temperature.
February 2021 was recorded as one of the hottest and driest months in the last 60 years of Pakistan. Most of the country experienced no rain except Gilgit, where glacier and 7000+ peaks are located. Deviation from historical normal was -84%! This dashboard has been created to investigate the root cause of the rapid climate change in Pakistan, which has wide-ranging impacts on the environment and its people. Historical data has been gathered on various climate indicators such as rainfall, temperature, forest area, water consumption and agricultural land. Also, population and water security risk data have been visualized to identify any trends.
The upper portion of the dashboard focuses on...
This showcase has no description
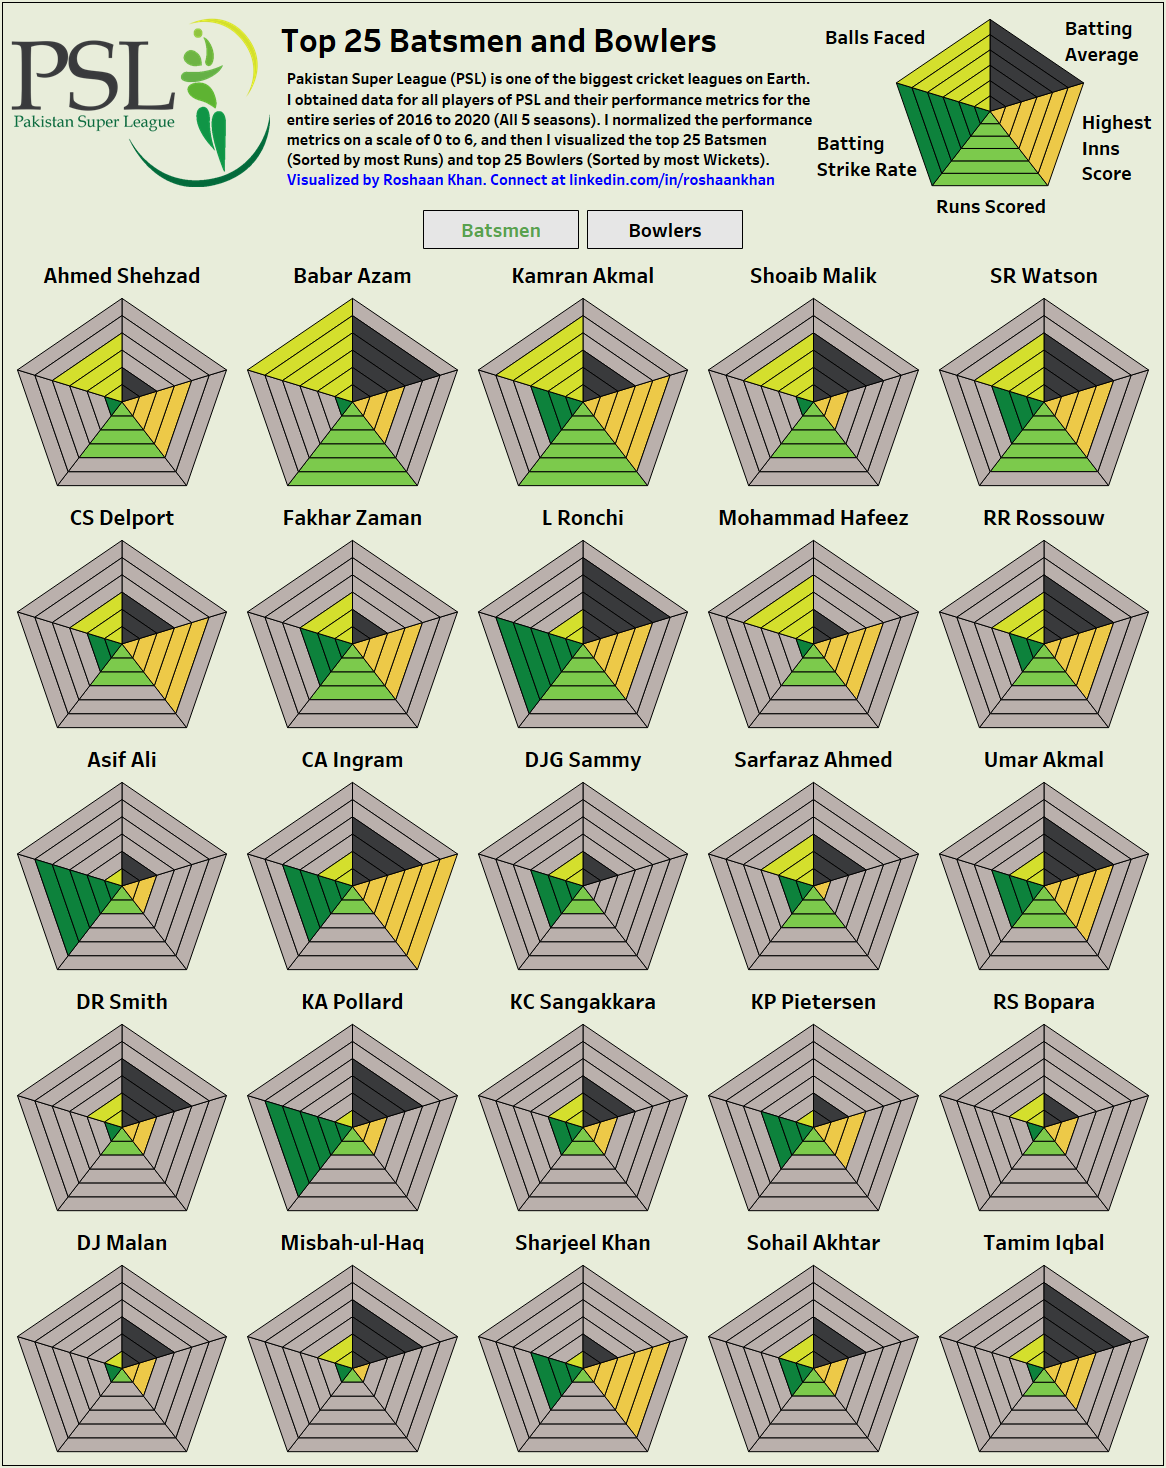
Pakistan Super League (PSL) is one of the biggest cricket leagues on Earth. They invite international players from around the world to come and compete in the local league. Open Data has been used for all players of PSL and their performance metrics for the entire series of 2016 to 2020 (All 5 seasons). For the purpose of analysis, performance metrics have been normalized on a scale of 0 to 6. Then the performance has been visualized for the top 25 Batsmen (They are ranked and sorted by Most Runs from the start) and top 25 Bowlers (They are ranked and sorted by Most Wickets from the start).
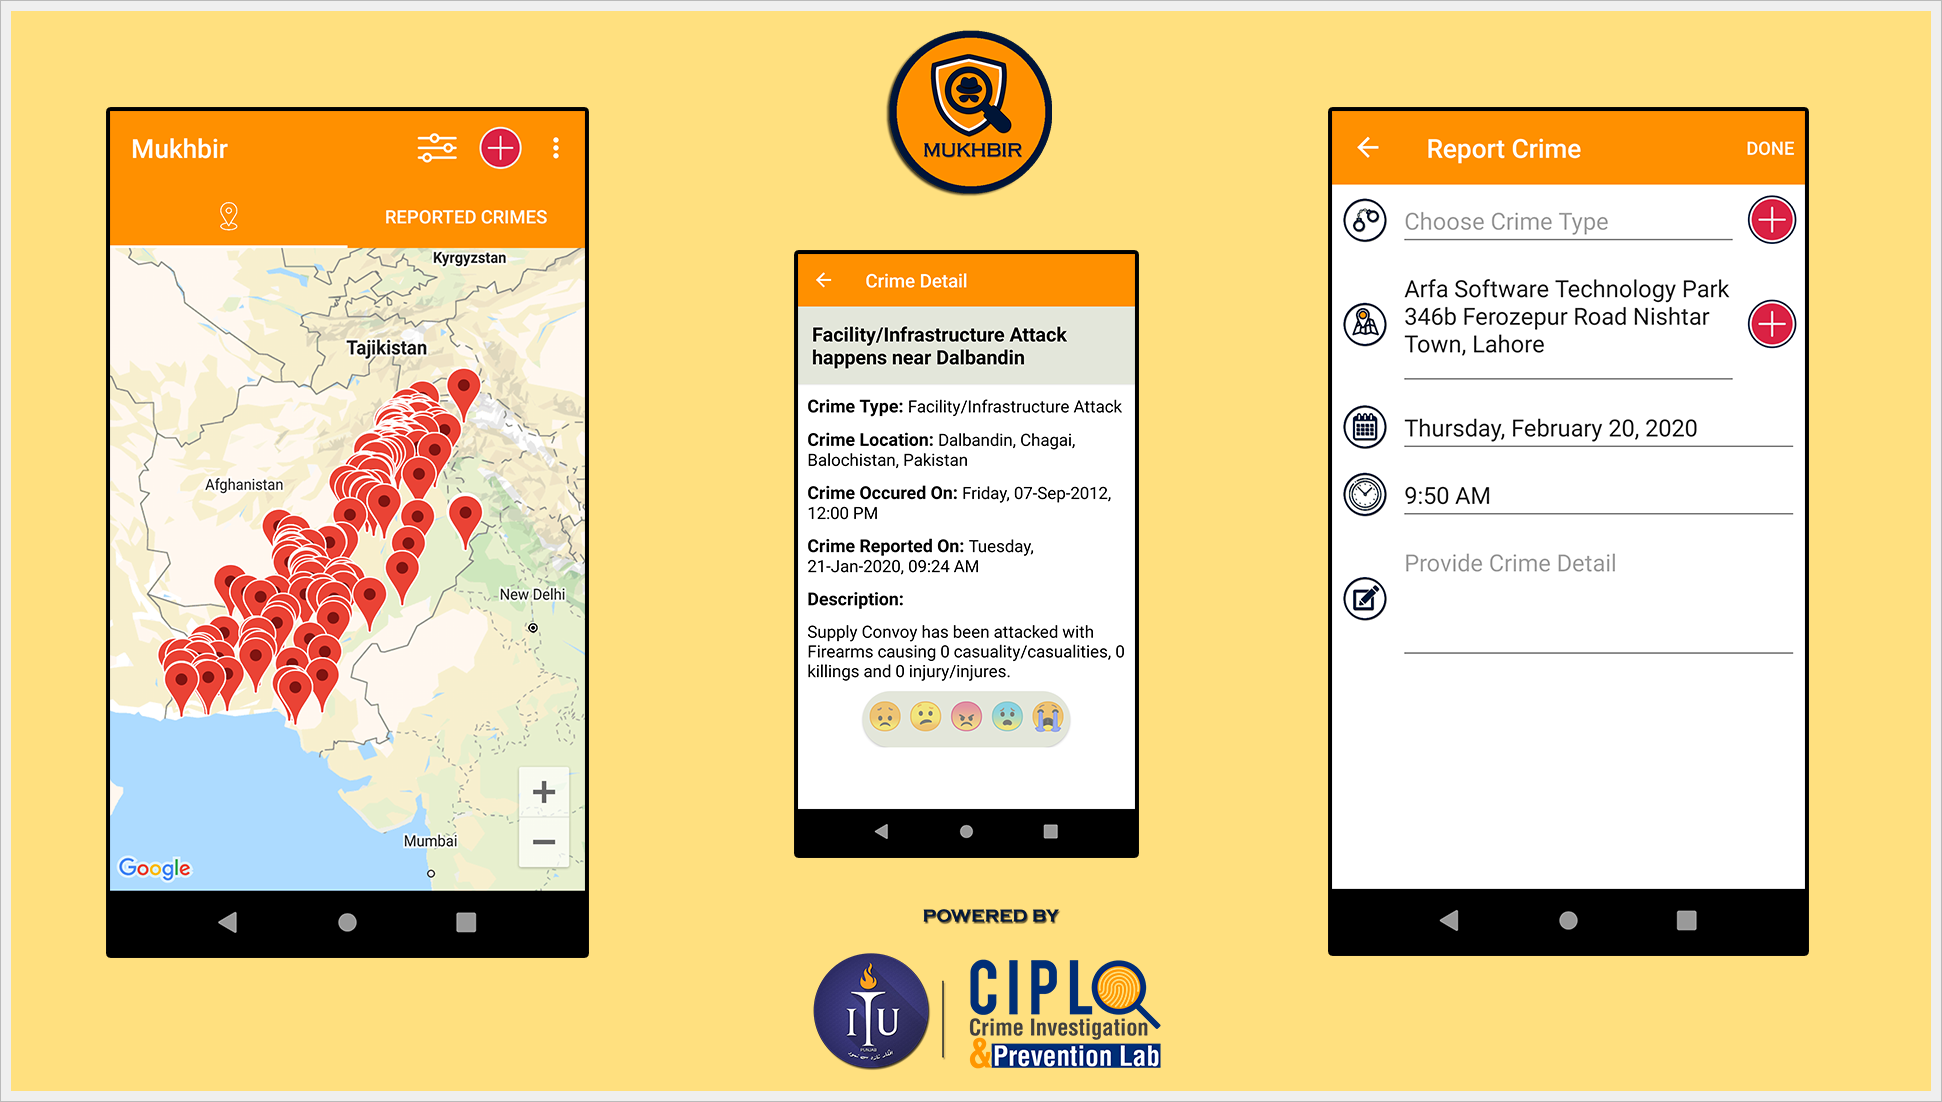
Law and order is a crucial characteristic of progressive, civilized societies. It is a fundamental responsibility of the government to provide a safe and orderly environment that is implemented through various departments and agencies. We are introducing the real-time anonymous crime reporting application "Mukhbir," which facilitates the general public to report crimes anonymously. Users can report and visualize reported crime details.
Mukhbir offers the following feature i.e
1. Reporting of Crimes.
2. Visualizing Crime Details.
3. Visualizing Reported Crimes.
4. Filtration of Reported Crimes.
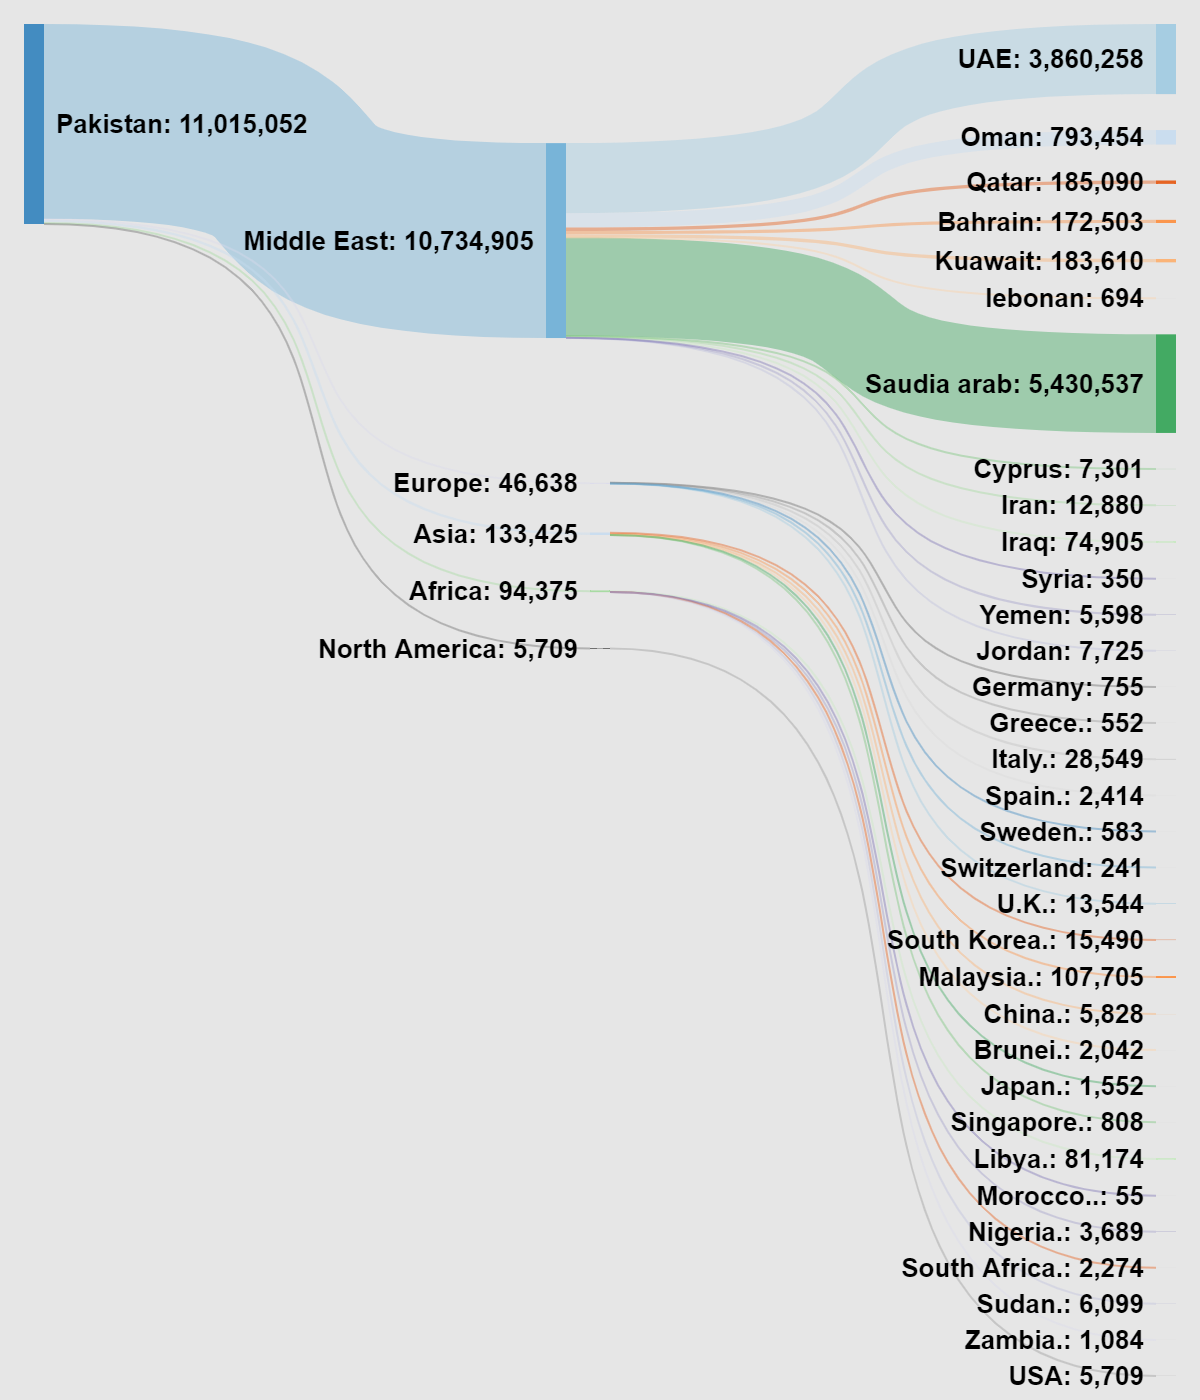
This sankey chart shows the intensity of people who emigrated from Pakistan to the following countries from 1970 to 2019.
Over the last two to three decades, the number of highly qualified and highly trained manpower from Pakistan has been moving. This number has been increasing rapidly due to a number of factors. Our analysis seems to focus concisely on the push and pull factors and by combining the two what actually leads to such a huge pool of people leaving their home country. Although, Pakistan enjoys the returns in form of remittances but do they outweigh the loss country faces in terms if real and qualified youth that’s much needed for a developing economy to prosper? What good...
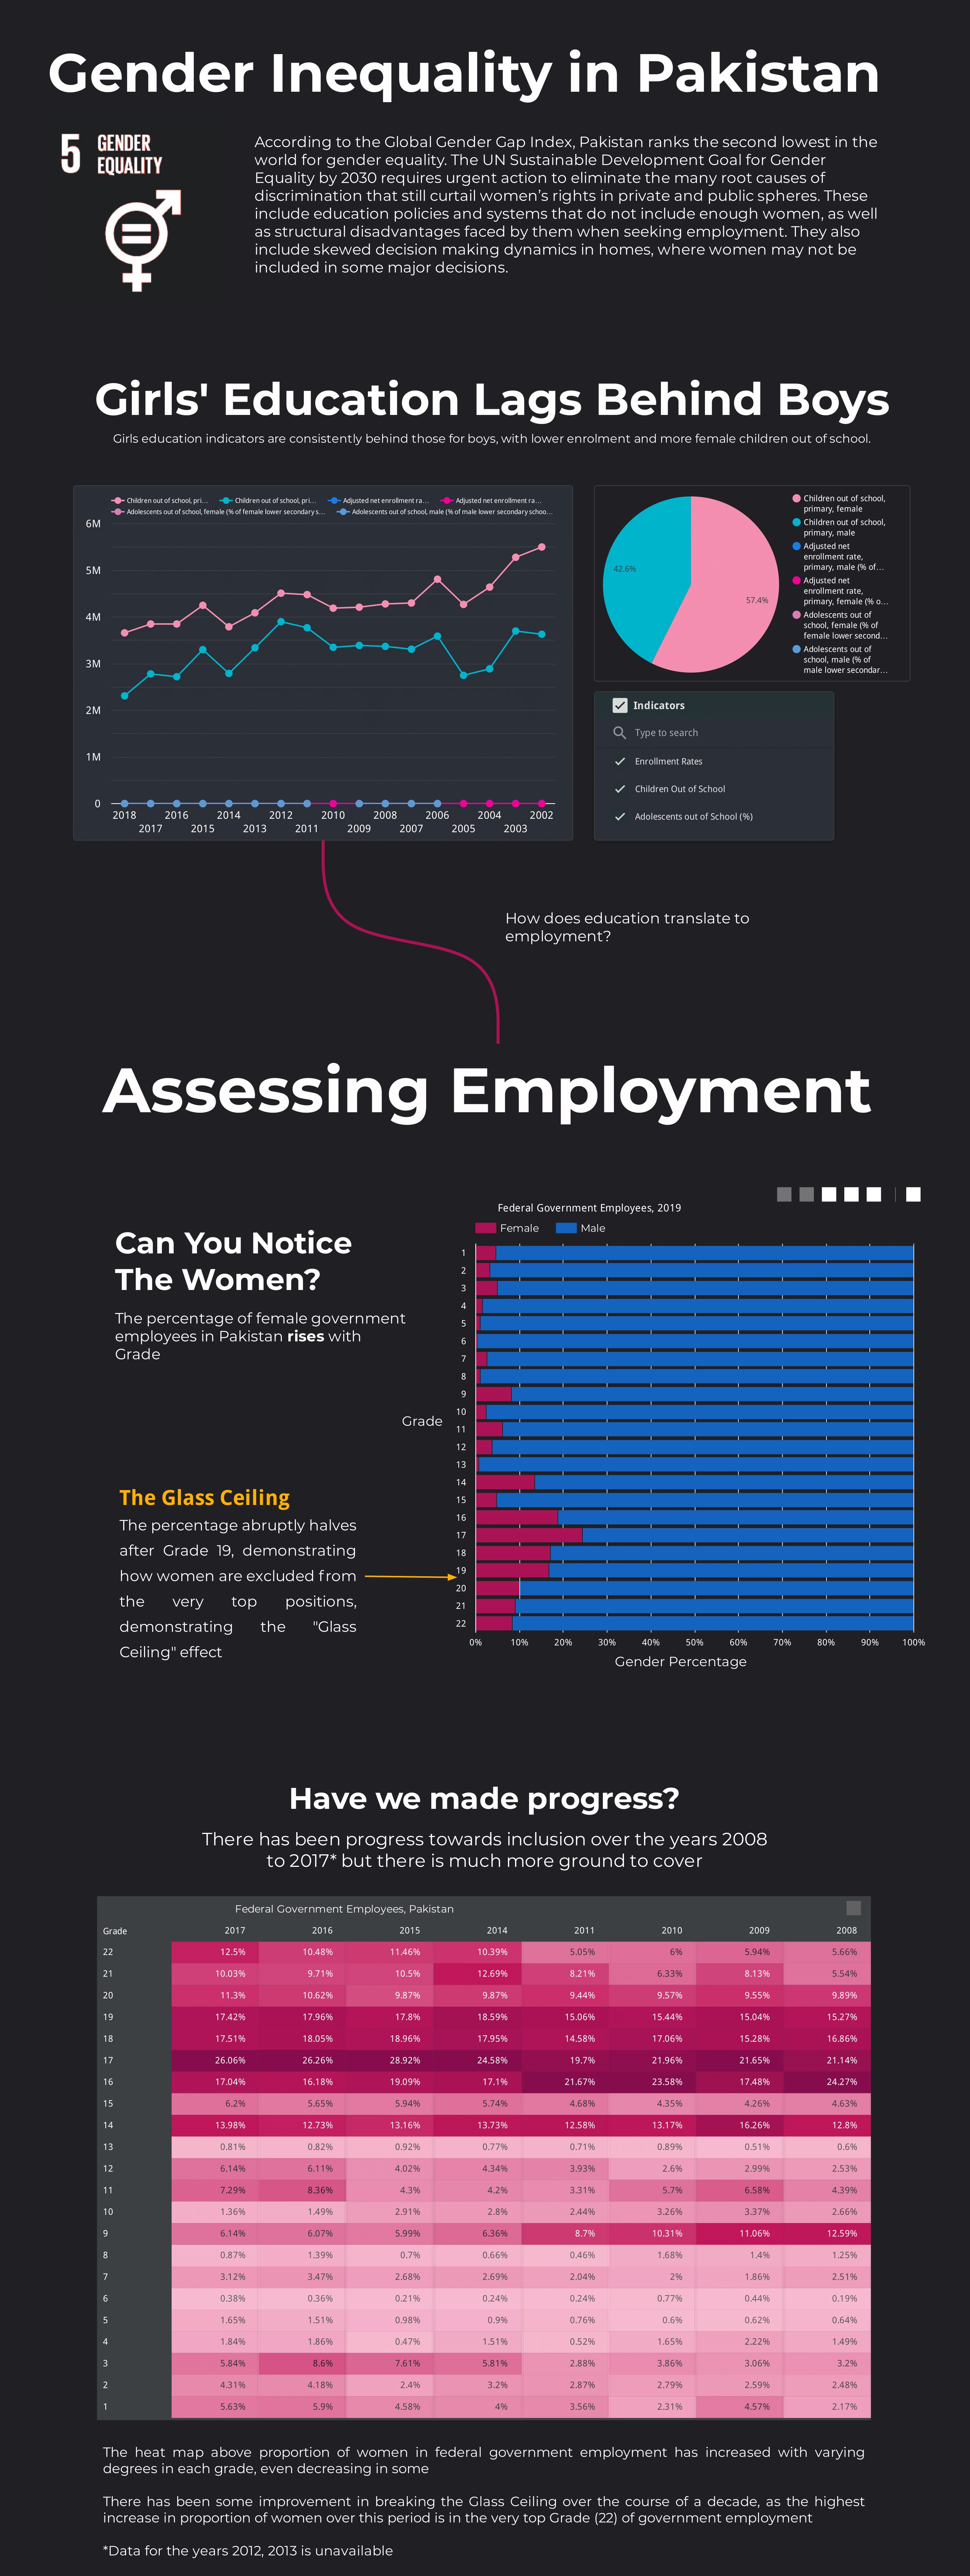
According to the Global Gender Gap Index, Pakistan ranks the second-lowest in the world for gender equality. The UN Sustainable Development Goal for Gender Equality by 2030 requires urgent action to eliminate the many root causes of discrimination that still curtail women’s rights in private and public spheres. These include education policies and systems that do not include enough women, as well as structural disadvantages faced by them when seeking employment. They also include skewed decision-making dynamics in homes, where women may not be major decision-makers.
The above dashboard addresses the prevailing gender inequality issue in Pakistan by measuring women's education and...
This dashboard represents the air quality index of four major cities of Pakistan over a year. The data contains a measure of PM 2.5 which is a major indicator for the air quality index. The data starts on 29 April 2019 and ends on 20 April 2020. The donut chart in this dashboard represents the average mean values for each of the cities. The bar chart indicates mean values for each city in different months. This represents the mean value for PM 2.5 throughout the year so helps us indicate which month is potentially hazardous with respect to Air Quality Index. The line chart indicates the trend for the air quality index throughout the whole year. This helps us point out the trend for each...
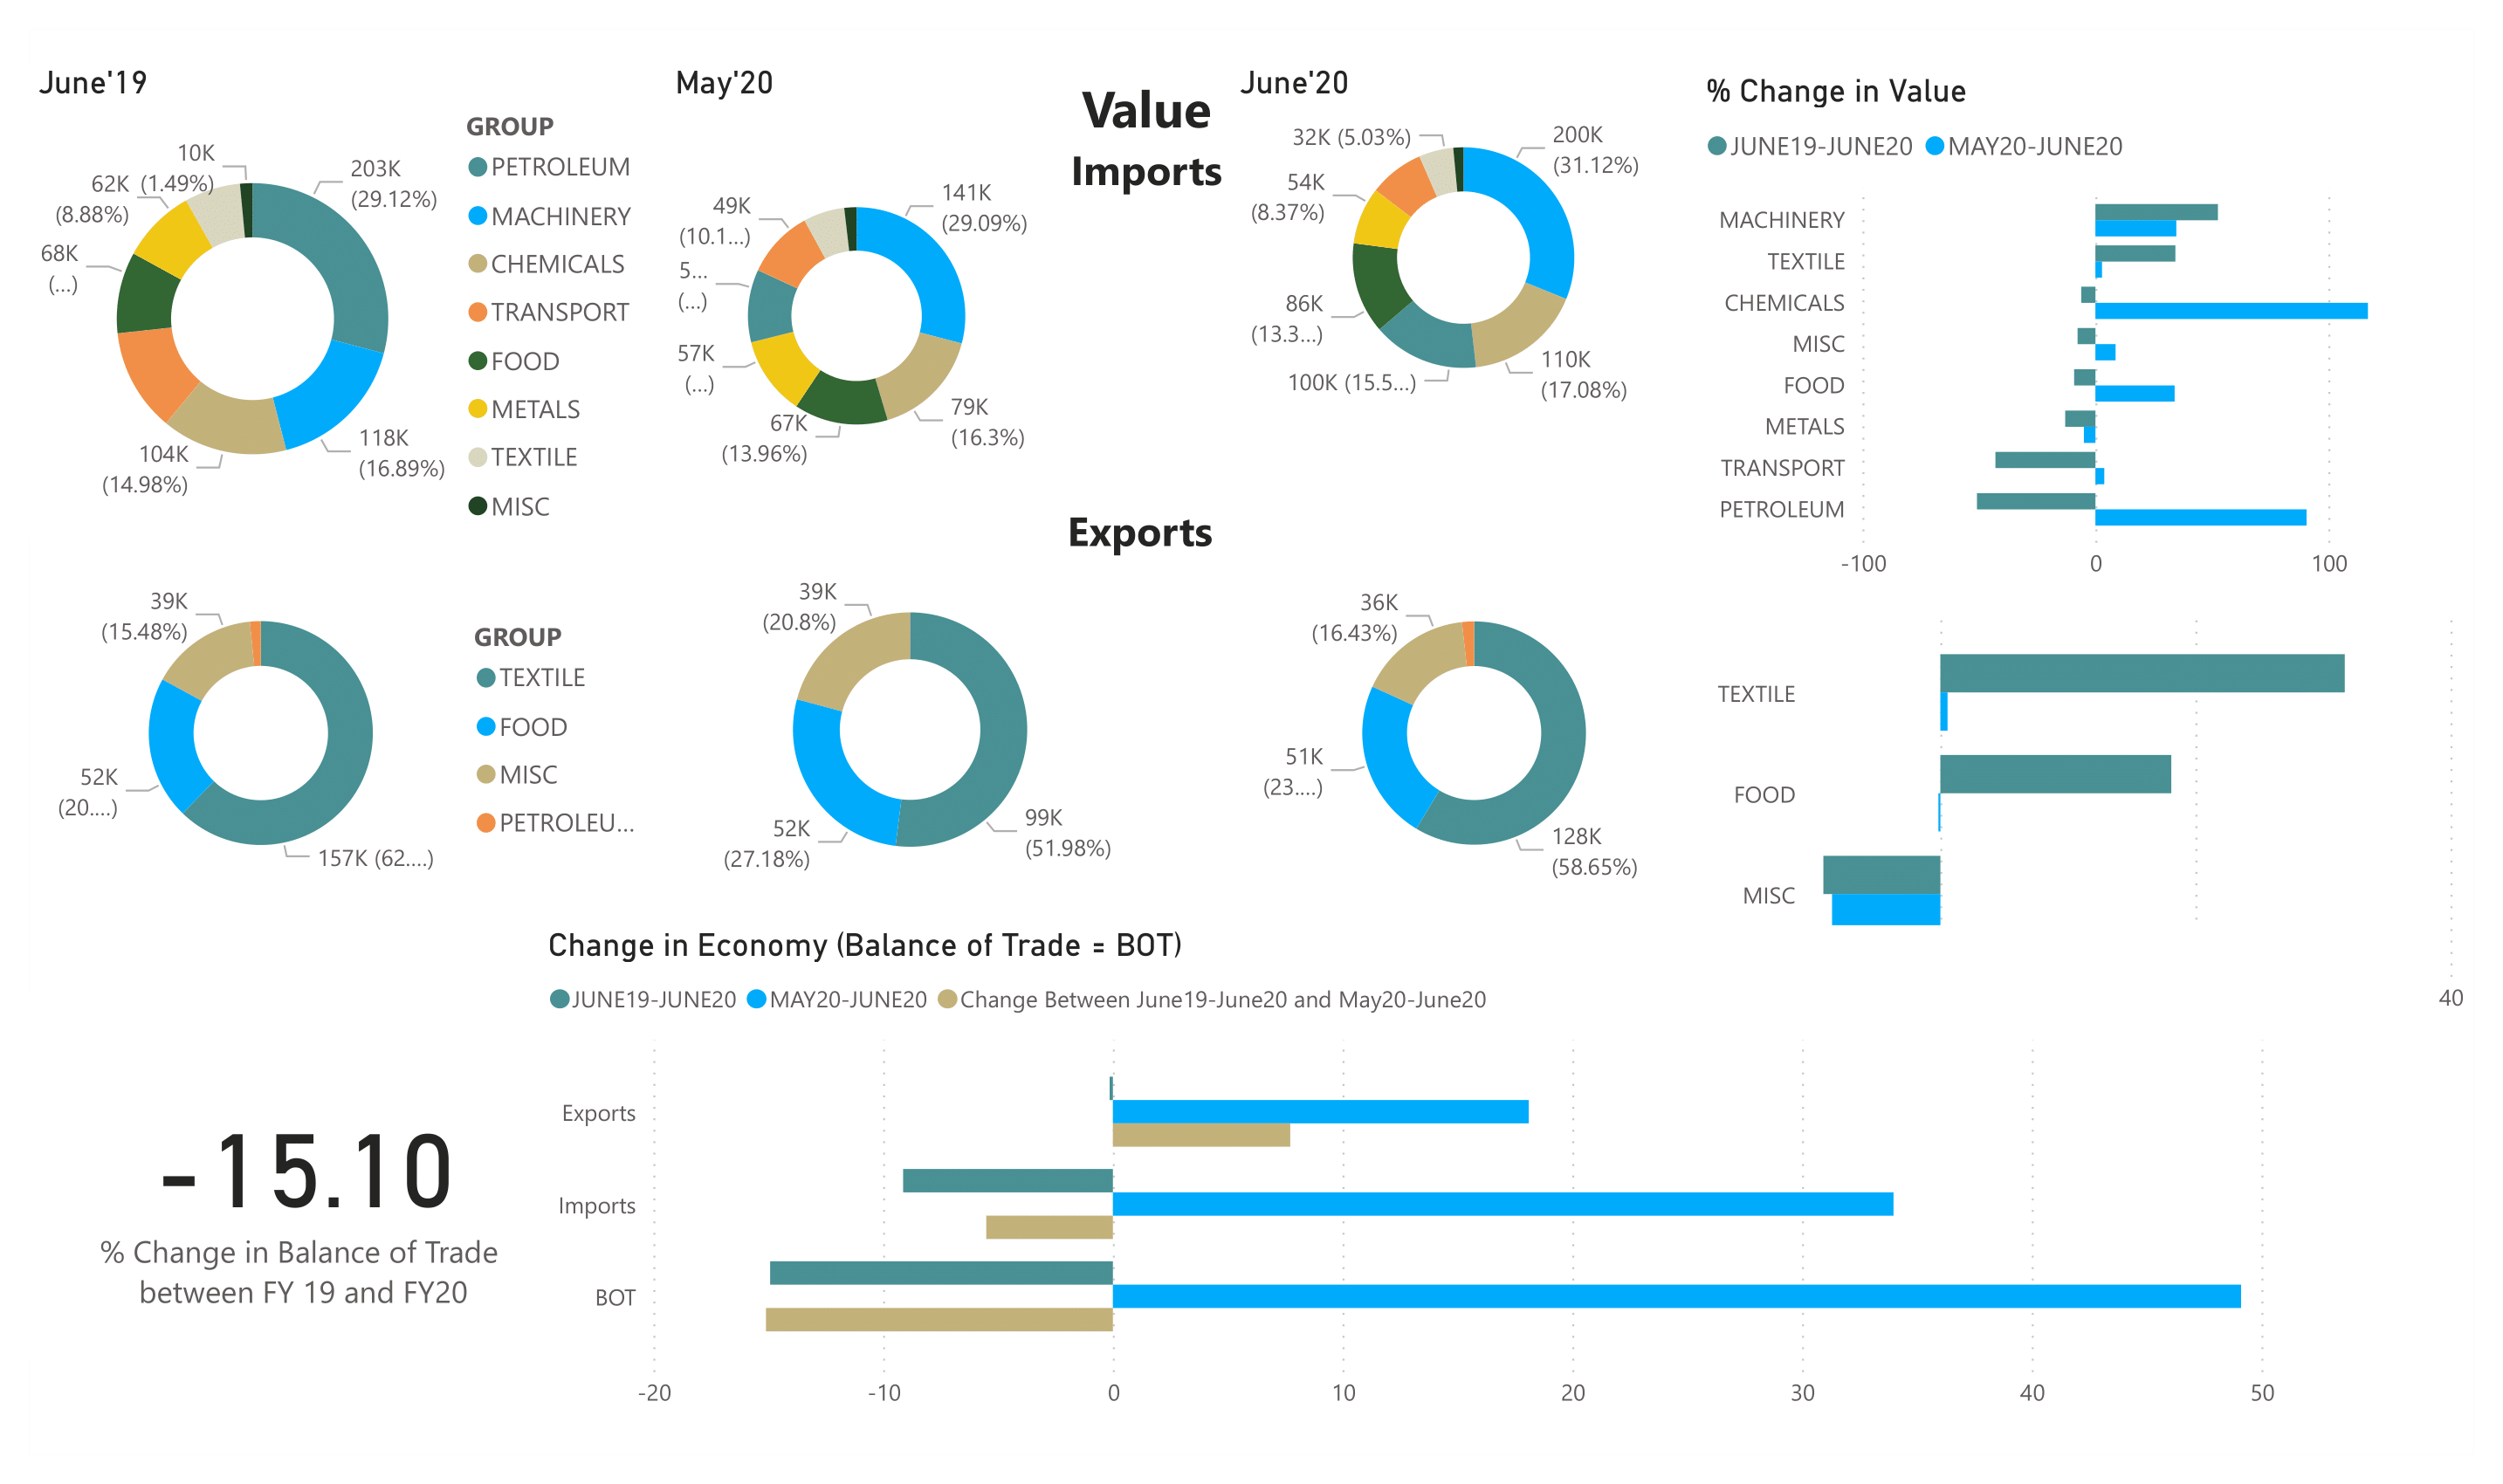
Economies worldwide have been greatly affected by the COVID-19 outbreak. A study demonstrated that trade shrunk by 3.5% globally. The above-presented dashboard aims to explore how the pandemic has affected Pakistan’s economy by determining the strength of correlation between the balance of trade connecting certain commodities. For this purpose, data has been used from the annual analytical report on External Trade Statistics of Pakistan, 2019-2020. This dataset includes information on exports, imports, and the Balance of Trade for different commodities.
For analysis, groups of commodities like Petroleum, Machinery, Chemicals, Transport, Food. Metals and textile have been created. We...
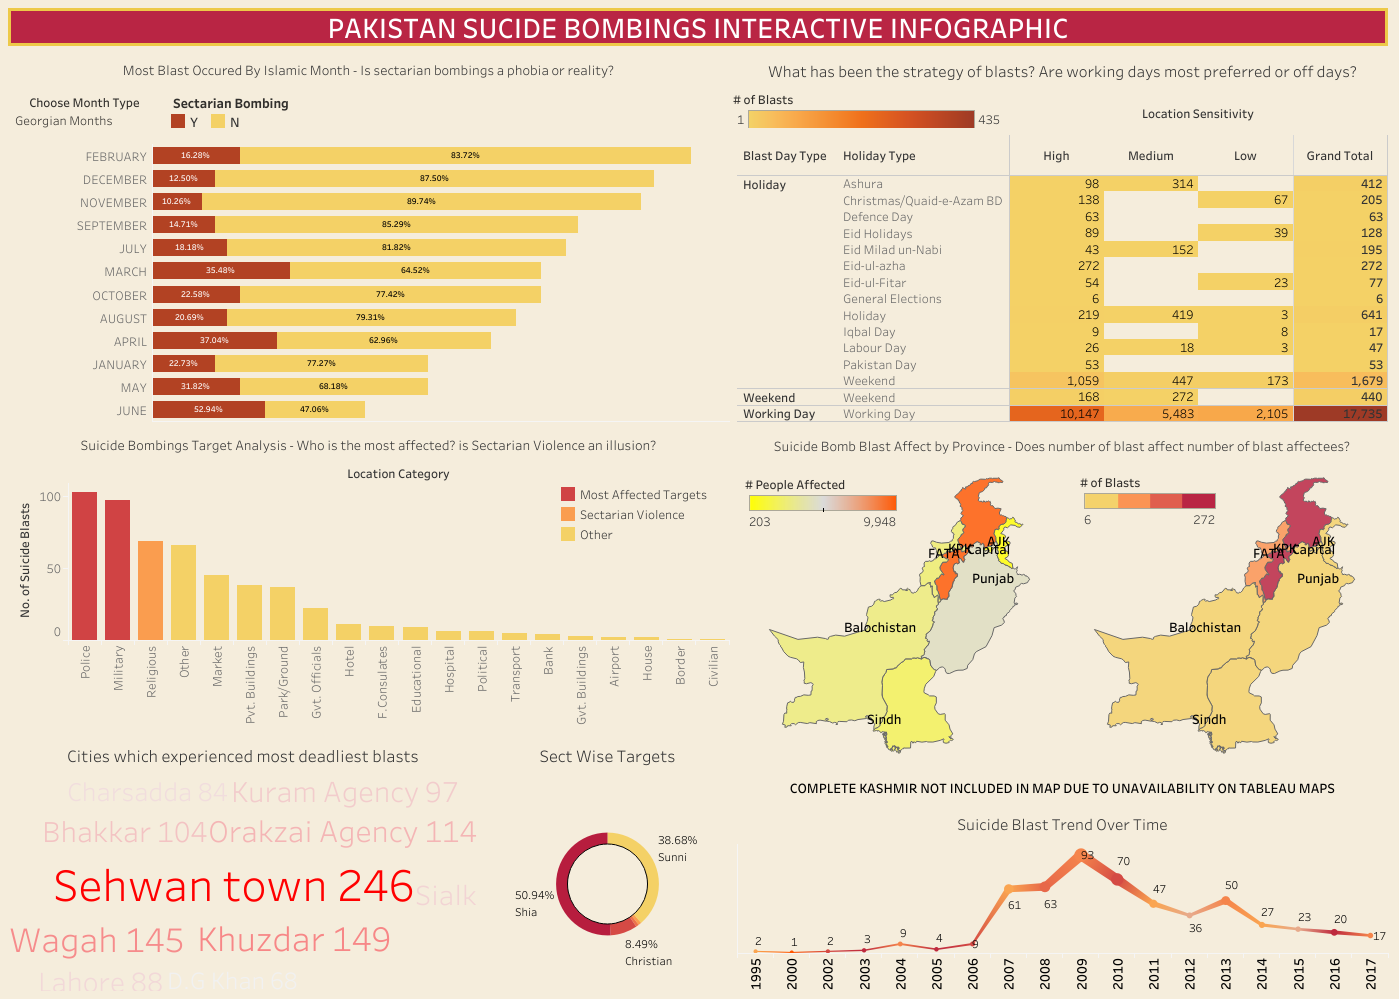
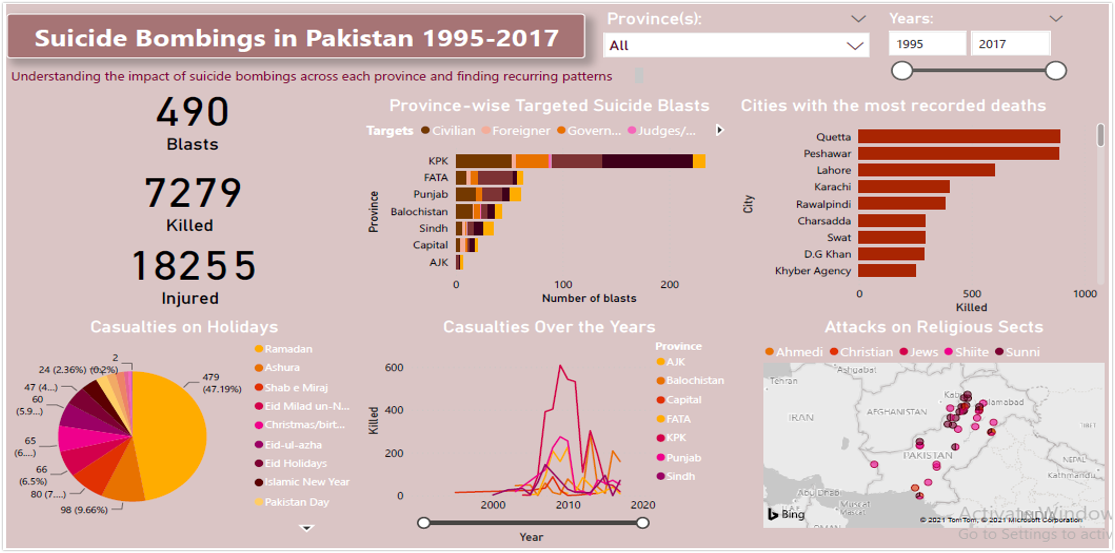
In order to devise strategies to prevent and mitigate suicide bombings, it is imperative to understand the impact of previous bombings. After careful analysis, we can identify recurring patterns and use these insights to formulate security plans that will assist armed forces and security personnel such as provincial police, Pakistan Rangers, and Pakistan Army in counter-terrorism. This will also create awareness among the common public to take preventative measures and eventually help in prevailing peace.
The national and provincial governments can analyze the trends presented by the dashboard and plan its strategies to counter this life-threatening adversity accordingly. The strategies...